This is another announcement from DO Labs that I've been sitting on until I could find time to write it up with the detail it deserves. In a previous news item, I reported on DxO Photo Pro, software with an amazing ability to correct a wide range of distortion and optical defects in digital images, post-capture. Underlying that product is technology to precisely measure (with sub-pixel resolution) such optical shortcomings as pincushion and barrel distortion, axial and radial blurring, chromatic aberration, and vignetting. This capability is embodied in a combination of test target and software called DxO Analyzer, which DO Labs is now offering commercially.

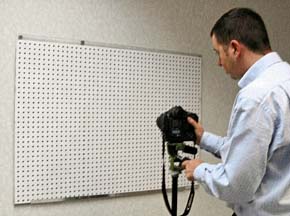
At the heart of the DxO Analyzer process is a precisely drawn test target, consisting of a rectilinear pattern of black dots on a white background. The test procedure is incredibly simple (provided that you're careful in your setup and lighting): Set up the target, illuminate it evenly (to within 0.1 EV), carefully align your camera so it's facing the target at a perfect right angle, frame the image so you've got the pattern of dots filling the active frame, and snap a picture. Once the image is captured, you run it through a piece of analysis software running on a Windows XP computer.
Because the test target is so precisely defined and has such simple geometry, the analysis software knows exactly where each dot should appear in the field of view (relative to all the others), and its precise dimensions, to sub-pixel accuracy.
Knowing what the target is supposed to look like, it's a pretty simple matter for the software to measure any deviations from the ideal that it finds in the test image. And it turns out that this information results in a pretty complete picture of the optical performance of the lens/camera system being tested.
Knowing exactly where the dots are and their precise shapes, DxO Analyzer can compute the extent to which they're blurred, relative to the image that would result with a perfect lens and an idealized sensor array. This leads to a measurement of resolution that correlates with human perception of "sharpness" much better than the usual resolution charts I and others have been using for years now.
Likewise, computing the displacements of the dots in the image from their ideal locations produces a very accurate map of geometric distortion (barrel and pincushion distortion), across the entire field of view.
By definition, chromatic aberration is the imaging of different wavelengths (colors) of light at different locations on the focal plane. By looking at the differential shift of the images of the dots on the red, green, and blue layers, a crude but surprisingly accurate measurement of chromatic aberration results.
Finally, by observing the variation in luminance across the target, vignetting or light falloff at the edges of the frame can be measured.
DxO Analyzer reports all these distortion parameters in a concise listing, which can be exported as HTML or an Excel spreadsheet, or stored within the program for later study and comparison.
Perhaps the most compelling innovation in DxO Analyzer though, is its use of "BxU" units for expressing sharpness. BxU stands for "Blur eXperience Units," a mathematical measurement that correlates very well with human perception of blur or softness in images.
I've long maintained that the digicam world needs a more perceptually relevant measure of resolution than the ubiquitous ISO-12233 target. The problem is that a camera's ability to resolve the lines on the standard ISO target can have little relationship with how sharp the camera's images appear to users. - At its simplest, sharpness and resolution have surprisingly little to do with each other.
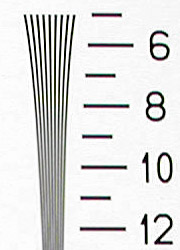
To see what I mean, consider the two crops below, from res target images shot with two different cameras.
| Camera "A" | Camera "B" |
 |  |
What's interesting here is that these two images actually show almost the same number of cleanly resolved lines of resolution, but there's no question that the image from Camera "B" looks dramatically sharper than that from Camera "A". This illustration also highlights a problem with how the ISO chart is typically used by reviewers (myself included). The tendency is to just report "lines of resolution", and sometimes "lines of resolution at extinction" (the point at which you can no longer distinguish the individual lines any more). That's find, but where exactly do you "call" the lines of resolution? There's a continuum of response here, so it's up to the individual reviewer's personal judgement as to just where the appropriate point is to say that the lines are no longer resolved cleanly.
Taking Camera B as an example of the imprecision inherent in this measurement, it's obvious that the target detail is cleanly resolved at the 900 line level, and that it's thoroughly blurred by the time we get to 1200 lines. But where exactly in between those two numbers do we say that the camera's actual "resolution" lies? 1000 lines? 1100? 1050? 1075? 1025? You can see that the nature of the test is such that it's pointless (and misleading) to use it to discriminate resolution values with a granularity of 25 or even 50 lines per picture height. Yet this is commonly done, and consumers routinely treat such measures as if they had some objective validity.
Historically, there are a number of other ways of evaluating image sharpness, including the Modulation Transfer Function (MTF) and the Point Spread Function (PSF). Once again though, these are inherently complex functions that correlate only loosely with human perception, and that resist distillation to a single number.
In their work, DO Labs' staff and advisors appear to have come up with a measure of image sharpness that's based on a purely mathematical calculation, and yet also correlates very well with human perception. (Mathematically, it's extracted from the convolution kernel that produces the observed blur.) Termed a "Blur Experience Unit" or "BxU" for short, DO Labs' blur metric embodies a number of very desirable features. Namely:
- It's mathematically defined, and therefore precise and highly repeatable.
- It produces a single numeric measurement that's easy to sort on.
- It correlates very well with human perception of blur.
- It's covariant to rescaling, changes of resolution, etc. This means that you can compare BxUs from digital cameras and imaging systems with different numbers of pixels, different sensor pixel sizes, etc.
- It can also measure the effects of software algorithms, to determine their effectiveness at reducing (or enhancing) blur. As a point of reference, DO Labs has set the magnitude of the BxU units such that a BxU variation of +1.0 corresponds to the "Blur More" function in Adobe Photoshop CS.
- BxU units are additive, so it's possible to add or subtract the BxU values of the various elements of an imaging chain to determine the amount of blur of the entire imaging chain.
So what does this all mean?
At the bottom line, it appears that DO Labs has developed a tool for evaluating optical quality that's far more accurate and objective than any other in widespread use. It also reduces image blur to a single, mathematically-determined number that correlates well with human perception, and provides a means for measuring that number quickly and reliably.
As I write this, a target and software for executing the DxO tests has just arrived. - I'll be setting it up over the next few days and running some preliminary tests with it. If its performance in my own lab matches what I've seen in demos, I'll be incorporating its results in all my digicam tests going forward.
Based on what I've seen thus far, DxO Analyzer should revolutionize digicam testing and reporting across the industry. I fully expect that you'll see it widely used by multiple testing organizations (although the cost of the target and software could be an obstacle for some).
Stay tuned for further developments!
(For reference, here's a link to the press release for DxO Analyzer .)