Panasonic G2 Imatest Results
We routinely use Norman Koren's excellent "Imatest" analysis program for quantitative, thoroughly objective analysis of digicam test images. I highly recommend it to our technically-oriented readers, as it's far and away the best, most comprehensive analysis program I've found to date.
My comments below are just brief observations of what we see in the Imatest results. A full discussion of all the data Imatest produces is really beyond the scope of this review: Visit the Imatest web site for a full discussion of what the program measures, how it performs its computations, and how to interpret its output.
Here's some of the results produced by Imatest for the Panasonic G2:
sRGB Accuracy Comparison |
|||
The Panasonic DMC-G2 showed generally good color accuracy, with only minor oversaturation of bright reds and deep blues. The G2 actually undersaturates some yellows, yellow-greens, and aqua hues. Hue accuracy was also generally good, with the typical cyan shift we see in most cameras we test, but the larger than average shift in the range of spectrum from orange through yellow that we've come to associate with Panasonic cameras. The shift of oranges toward yellow and yellows toward green was evident in some of our test images, most notably those of the Still Life scene, where it's difficult to distinguish the colors of the yellow-green through orange embroidery thread samples. All of the previous G-series models from Panasonic have show similar with this range of yellow through orange in our tests; an odd and ongoing color error that amounts to one of the few practical strikes against their image quality. (The good news is that this color problem goes away if you process their RAW images through a good-quality RAW converter program.) Average saturation for the Panasonic G2 was 108.9% (oversaturated by 8.9%, mostly in the reds, blues, and purples). Average "delta-C" color error was 6.88 after correction for saturation, which we once would have considered very good, but now is only about average, given improvements in camera color handling over the last couple of years. (Delta-C is the same as the more commonly referred to delta-E, but delta-C takes into account only color differences, ignoring luminance variation.) All in all, a good color response for this class of camera, marred only by the puzzling yellow through orange hue issue. Mouse over the links below the illustration above to compare results with recent consumer SLDs, as well as the Panasonic G1.
Adobe RGB Accuracy Comparison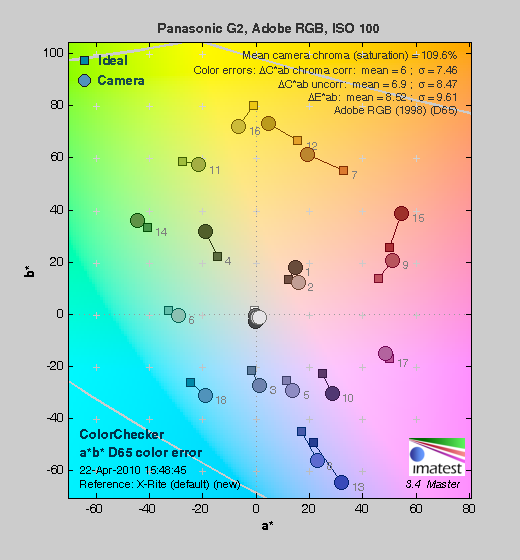 |
|||
Most SLRs/SLDs dramatically oversaturate colors when shooting in Adobe RGB mode, but the Panasonic G2 is a bit more restrained, increasing saturation only slightly beyond that in sRGB mode. Average saturation was 109.6% which is only slightly greater, and average saturation-corrected hue error was 6.01 "delta-C" units, slightly more accurate than the sRGB result. Again, mouse over the links below the illustration above to compare results with recent entry-level SLRs.
Panasonic G2 Color Analysis
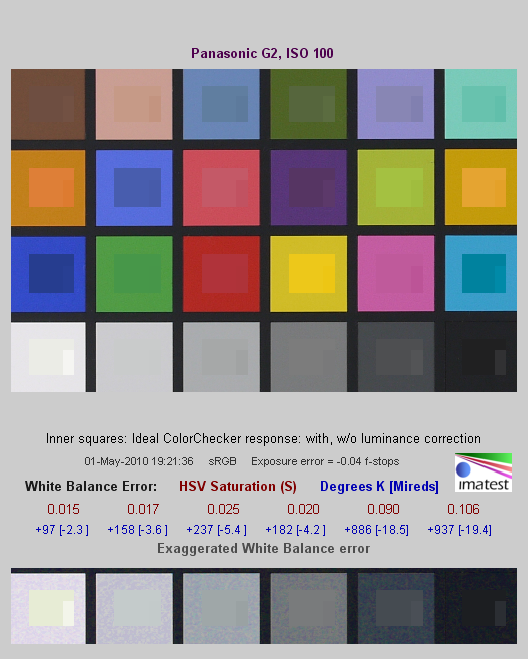
This image shows how the Panasonic G2 actually rendered the colors of the MacBeth chart, compared to a numerically ideal treatment. In each color swatch, the outer perimeter shows the color as actually captured by the camera, the inner square shows the numerically correct color after correcting for the luminance of the photographed chart (as determined by a second-order curve fit to the values of the gray swatches), and the small rectangle inside the inner square shows the numerically correct color, without the luminance correction. This image shows the generally good hue and saturation accuracy, but the greenish tinge in the bright yellow and orange swatches is very evident, and the lime-green patch is rendered in a slightly dingy hue with a bit of a brown cast. The as-captured colors are somewhat bright for many blues, but rather dark for some warm tones, notably yellows and oranges. We did notice some yellows were noticeably dull and greenish in some of our test images (see the yellow yarn in our Still Life target), and that a range of colors from yellow through orange were difficult to distinguish from each other, but felt that the overall visual impact of the G2's color was quite positive. If Panasonic could just clean up their handling of the range of spectrum from orange through yellow-green, the G2's color would be truly impressive. (We made the same comment for the G1, GH1, and GF1 before it.)
Panasonic G2 Noise Analysis
As always, there's more in this particular graph than we really have room to go into here. (Also note that this set of plots has also changed a few revisions back in Imatest. Some of the plots that were once shown here are now shown in other Imatest output. Since we largely focus on the Noise Spectrum plot, we only show the graphic above, which includes that plot.)
In comparing these graphs with those from competing cameras, I've found that the Noise Spectrum graph at lower right is often the most important. Cameras that manage to shift their noise spectrum to higher frequencies have much finer-grained noise structures, making their noise less visually objectionable. In the graph above, this would show up as a noise spectrum curve that remained higher on the right side, representing higher noise frequencies.
In the case of the Panasonic G2, we find a lot of noise energy concentrated at lower spatial frequencies, especially in the blue and red channels. Fortunately, the overall noise levels at ISO 100 (lower left-hand plot above) are low enough that you have to really crank up the contrast to be able to see much noise at all. Midtone noise levels are slightly higher than some competing models, but the levels are low enough that you're not likely to notice noise at ISO 100 unless you're doing pretty extreme tonal modifications.
Above is the same set of noise data at ISO 1,600. Here, the Noise Spectrum graph is shifted overall a bit toward the left-hand, lower-frequency side than it was at ISO 100, coarsening the "grain" of the image noise patterns, but there's little difference between the color channels in this plot, with blue and green tracking the luminance noise very closely, and only the red-channel noise being a bit elevated at the lowest frequencies. This is a big unusual; finding the differential between chroma and luminance noise lower at high ISOs than at low ones. (We observed this in the GH1's noise plots, while the noise behaviors of the original G1 and recent GF1 were more conventional.) Overall noise levels here are generally on par with those from competing models from Olympus (E-P2) and Samsung (NX10) at the time of this writing in late April, 2010.
Here's the same set of noise data at ISO 3,200. Here again, the Noise Spectrum graph is shifted even more toward the left-hand side, further coarsening the "grain" of the image noise patterns further.
This chart compares the Panasonic G2's noise performance over a range of ISOs against that of other SLR-style cameras capable of video recording. While we continue to show noise plots of this sort because readers ask for them, we each time point out that the noise magnitude is only a small part of the story, the grain pattern being much more important, not to mention what the camera does to achieve a given noise level. (Some cameras obliterate subject detail along with noise, so the camera with the lowest noise levels on MacBeth chart swatches may not necessarily produce the most appealing images.) Here, the Panasonic G2's luminance noise level is on par with the competition (higher than most, but lower than that of the Olympus E-P2) up through ISO 400. At ISO 800, its noise is a bit elevated, while that of all its competitors is lower (some models, like the E-P2 apply much heavier noise reduction processing starting at ISO 800, so their noise levels actually drop, but at the cost of image detail.) At ISO 1,600 and 3,200, it manages less noise than did the original DMC-G1, but again shows more noise than its competition. It does better than both the G1 and GF1 at ISO 3,200, but higher than its competitors. Of the cameras shown, only the Olympus E-P2 offers ISO 6,400, and it maintains its edge over the G2 at that ISO setting as well. Noise levels will obviously change depending on the noise reduction setting used in the camera when the test chart image was captured: All the results above were shot with each camera's default noise reduction settings applied.
Panasonic G2 Dynamic Range Analysis
A key parameter in a digital camera is its Dynamic Range, the range of brightness that can be faithfully recorded. At the upper end of the tonal scale, dynamic range is dictated by the point at which the RGB data "saturates" at values of 255, 255, 255. At the lower end of the tonal scale, dynamic range is determined by the point at which there ceases to be any useful difference between adjacent tonal steps. Note the use of the qualifier "useful" in there: While it's tempting to evaluate dynamic range as the maximum number of tonal steps that can be discerned at all, that measure of dynamic range has very little relevance to real-world photography. What we care about as photographers is how much detail we can pull out of the shadows before image noise becomes too objectionable. This, of course, is a very subjective matter, and will vary with the application and even the subject matter in question. (Noise will be much more visible in subjects with large areas of flat tints and subtle shading than it would in subjects with strong, highly contrasting surface texture.)
What makes most sense then, is to specify useful dynamic range in terms of the point at which image noise reaches some agreed-upon threshold. To this end, Imatest computes a number of different dynamic range measurements, based on a variety of image noise thresholds. The noise thresholds are specified in terms of f-stops of equivalent luminance variation in the final image file, and dynamic range is computed for noise thresholds of 1.0 (low image quality), 0.5 (medium image quality), 0.25 (medium-high image quality) and 0.1 (high image quality). For most photographers and most applications, the noise thresholds of 0.5 and 0.25 f-stops are probably the most relevant to the production of acceptable-quality finished images, but many noise-sensitive shooters will insist on the 0.1 f-stop limit for their most critical work.
The image below shows the test results from Imatest for an in-camera JPEG file from the Panasonic G2 with a nominally-exposed density step target (Stouffer 4110), and its settings such as Contrast and iExposure at their default positions.
Here, we can see that the tone curve maintains good gradation in both the highlights and shadows, with a nice "S"-shaped curve. These results beat those from competing SLD models (Olympus E-P2 and Samsung NX10), but lag behind those from the larger APS-C sensors used in many SLR designs. (Interestingly, though, the Panasonic G2 does do good bit better than the Samsung NX10, which uses an APS-C sensor in a SLD design.) The recent Panasonic GF1 does a bit better across the board, and the earlier Panasonic GH1 did much better at the highest quality threshold, but worse at lower ones.
It's important to note here, though, that the in-camera noise suppression can have a large impact on these dynamic range numbers. Panasonic chose to leave a bit more noise in the G2's images, in order to also leave more fine/subtle detail than some cameras do. This can result in lower dynamic range numbers at a given quality level than would be the case with cameras that trade off subject detail for lower noise ratings. At quality thresholds lower than the maximum, the Panasonic G2 actually holds its own with many APS-C sensor cameras.
Above are the results with iExposure adjusted to the Low setting. It produced almost no difference in the Imatest scores.
Above are the results with iExposure turned at the Standard setting. Again, almost no impact on measured dynamic range.
Above are the results with iExposure turned at the High setting. This time, there was a slight drop at the medium-high quality level, and a more marked decrease in total dynamic range. The impact on the tone curve is clear, though, in the form of a more-gentle tapering off at the highlight end, and a more abrupt falloff at the shadow end.
The illustration above shows the results from Adobe Camera Raw 5.7, with Auto settings (slightly better results are likely possible with manually tweaking, but we weren't able to do any better). As can be seen, the score at the highest quality level increased about 2/3 f-stop relative to that from camera JPEGs, and thresholds from Medium on down through Low also showed similar improvement. Total dynamic range increased by 1.2 f-stops, from 10.8 to 12 f-stops.
Dynamic Range, the bottom line:
The net result was that the Panasonic G2 showed very good dynamic range when compared against other current Four-Thirds models, but lags behind most DSLRs with APS-C size sensors. Panasonic G2 RAW files processed in Adobe Camera Raw also had very good Imatest dynamic range scores compared to other Four Thirds models, but again, scores lagged models with APS-C sensors.
To get some perspective, here's a summary of the Panasonic G2's dynamic range performance, and how it compares to other digital SLRs that we also have Imatest dynamic range data for. (Results are arranged in order of decreasing dynamic range at the "High" quality level.):
| Dynamic Range (in f-stops) vs Image Quality (At camera's base ISO) (Blue = RAW via ACR, Yellow=Camera JPEG, Green=Current Camera) |
||||
| Model | 1.0 (Low) |
0.5 (Medium) |
0.25 (Med-High) |
0.1 (High) |
| Nikon D3X (Adobe Camera Raw 5.3b) |
-- | -- | 11.1 | 9.64 |
| Nikon D3S (Adobe Camera Raw 5.6) |
-- | -- | 10.7 | 9.55 |
| Nikon D700 (Adobe Camera Raw 4.5) |
12.1 | 11.6 | 10.6 | 9.51 |
| Nikon D5000 (Adobe Camera Raw 5.4b) |
-- | 11.6 | 10.8 | 9.50 |
| Sony A900 (Adobe Camera Raw 4.6b) |
-- | 12.1 | 10.7 | 9.36 |
| Pentax K-x (Adobe Camera Raw 5.6b) |
11.5 | 11.2 | 10.7 | 9.33 |
| Nikon D90 (Adobe Camera Raw 4.6b) |
12.1 | 11.8 | 10.7 | 9.27 |
| Fujifilm S3 Pro (Adobe Camera Raw 2) |
12.1 | 11.7 | 10.7 | 9.00 |
| Sony A230 (Adobe Camera Raw 5.5) |
11.7 | 11.1 | 10.1 | 8.95 |
| Nikon D40x (Adobe Camera Raw 4.1) |
12.0 | 10.9 | 10.3 | 8.90 |
| Nikon D300S (Adobe Camera Raw 5.5) |
-- | 11.3 | 10.4 | 8.89 |
| Canon 5D Mark II (Adobe Camera Raw 5.2) |
-- | 10.8 | 10.0 | 8.89 |
| Sony A330 (Adobe Camera Raw 5.4) |
-- | -- | 10.1 | 8.86 |
| Canon EOS-1Ds Mark III (Adobe Camera Raw 4.5) |
11.5 | 10.7 | 9.96 | 8.84 |
| Nikon D3 (Adobe Camera Raw 4.5) |
11.7 | 11.0 | 10.0 | 8.75 |
| Canon EOS-1D Mark III (Adobe Camera Raw 4.5) |
11.7 | 10.7 | 9.99 | 8.73 |
| Sony A380 (Adobe Camera Raw 5.5) |
11.8 | 10.9 | 10.1 | 8.62 |
| Nikon D3000 (Adobe Camera Raw 5.5) |
-- | 10.8 | 10.1 | 8.61 |
| Pentax K20D (Adobe Camera Raw 4.5) |
11.4 | 10.6 | 9.82 | 8.56 |
| 8.5 Stops | ||||
| Nikon D300 (Adobe Camera Raw 4.3.1) |
11.4 | 10.9 | 9.87 | 8.45 |
| Sony A200 (Adobe Camera Raw 4.3.1) |
11.6 | 10.4 | 9.82 | 8.43 |
| Nikon D60 (Adobe Camera Raw 4.4.1) |
11.6 | 10.5 | 9.74 | 8.31 |
| Nikon D40 (Adobe Camera Raw 4.1) |
11.9 | 10.9 | 9.89 | 8.30 |
| Canon EOS-1Ds Mark III (Camera JPEG) |
10.9 | 10.2 | 9.71 | 8.23 |
| Pentax K100D (Adobe Camera Raw 3.6) |
11.3 | 10.3 | 9.51 | 8.23 |
| Pentax K200D (Adobe Camera Raw 4.4.1) |
-- | 10.5 | 9.54 | 8.19 |
| Pentax K10D (Adobe Camera Raw 3.7) |
10.6 | 10.0 | 9.29 | 8.19 |
| Canon 7D (Adobe Camera Raw 5.6) |
11.2 | 10.3 | 9.52 | 8.18 |
| Sony A100 (Adobe Camera Raw 3.4) |
11.3 | 10.5 | 9.69 | 8.16 |
| Canon EOS-1Ds Mark II (Adobe Camera Raw 3) |
11.2 | 10.3 | 9.40 | 8.14 |
| Canon EOS 50D (Adobe Camera Raw 4.6) |
11.2 | 10.5 | 9.49 | 8.06 |
| Nikon D40x (Camera JPEG) |
10.8 | 10.0 | 9.42 | 8.04 |
| Olympus E-P1 (ISO 200, Adobe Camera Raw 5.5) |
11.5 | 10.4 | 9.26 | 8.04 |
| Canon Rebel XSi (Camera JPEG) (ALO on by default) |
11.3 | 10.1 | 9.34 | 8.01 |
| 8.0 Stops | ||||
| Nikon D3S (Camera JPEG) |
-- | -- | -- | 7.96 |
| Fujifilm S3 Pro (Camera JPEG) |
-- | 9.90 | 9.40 | 7.94 |
| Samsung NX10 (Adobe Camera Raw 5.7 beta) |
-- | -- | 9.18 | 7.91 |
| Sony A350 (Adobe Camera Raw 4.4) |
11.6 | 10.5 | 9.61 | 7.89 |
| Canon EOS-1D Mark III (Camera JPEG) |
-- | 10.2 | 9.70 | 7.88 |
| Olympus E-P2 (Adobe Camera Raw 5.6) |
-- | 10.2 | 9.44 | 7.88 |
| Canon Rebel XS (Adobe Camera Raw 4.5) |
-- | 10.3 | 9.27 | 7.88 |
| Nikon D3 (Camera JPEG) |
-- | -- | -- | 7.87 |
| Canon Digital Rebel XTi (Adobe Camera Raw 3.6) |
10.8 | 9.88 | 9.18 | 7.84 |
| Canon EOS 5D (Adobe Camera Raw 3) |
11.0 | 10.4 | 9.21 | 7.83 |
| Nikon D90 (Camera JPEG) |
-- | -- | -- | 7.77 |
| Panasonic DMC-GH1 (Adobe Camera Raw 5.4b) |
9.88 | -- | 9.30 | 7.76 |
| Canon Rebel T1i (Adobe Camera Raw 5.4b) |
11.2 | 10.2 | 9.16 | 7.73 |
| Pentax K-7 (Adobe Camera Raw 5.4) |
10.6 | 9.93 | 9.07 | 7.73 |
| Canon EOS 40D (Adobe Camera Raw 4.2) |
11.2 | 10.1 | 9.26 | 7.72 |
| Panasonic DMC-GH1 (Camera JPEG) |
8.77 | -- | -- | 7.70 |
| Canon Rebel XSi (Adobe Camera Raw 4.4.1) |
10.6 | 9.95 | 9.10 | 7.68 |
| Canon EOS 50D (Camera JPEG) (ALO STD by default) |
-- | -- | 8.90 | 7.68 |
| Nikon D700 (Camera JPEG) |
-- | -- | 9.05 | 7.67 |
| Canon 5D Mark II (Camera JPEG) (ALO STD by default) |
10.6 | 9.68 | 8.98 | 7.66 |
| Nikon D5000 (Camera JPEG) |
-- | -- | 8.96 | 7.65 |
| Canon EOS-5D (Camera JPEG) |
10.2 | 9.68 | 8.82 | 7.65 |
| Olympus E-3 (Adobe Camera Raw 4.3) |
10.3 | 10.1 | 9.29 | 7.64 |
| Nikon D60 (Camera JPEG) |
10.5 | 9.62 | 8.89 | 7.62 |
| Nikon D200 (Adobe Camera Raw 3) |
10.6 | 9.65 | 8.96 | 7.61 |
| Canon 7D (Camera JPEG) (ALO STD by default) |
-- | 9.70 | 8.54 | 7.54 |
| Nikon D80 (Adobe Camera Raw 3.6) |
11.1 | 10.4 | 9.42 | 7.51 |
| 7.5 Stops | ||||
| Nikon D300S (Camera JPEG) |
-- | -- | -- | 7.49 |
| Olympus E-500 (Adobe Camera Raw 3) |
10.7 | 9.97 | 8.90 | 7.46 |
| Olympus E-510 (Adobe Camera Raw 4.1) |
10.0 | 9.43 | 8.64 | 7.46 |
| Pentax K10D (Camera JPEG) |
-- | 9.49 | 8.88 | 7.44 |
| Nikon D300 (Camera JPEG) |
-- | -- | 8.70 | 7.44 |
| Olympus E-420 (Adobe Camera Raw 4.1.1) |
10.0 | 9.61 | 8.65 | 7.44 |
| Canon Rebel T1i (Camera JPEG) (ALO=STD by default) |
11.3 | 10.1 | 9.34 | 7.43 |
| Nikon D2Xs (Adobe Camera Raw 3.6) |
10.6 | 9.90 | 8.93 | 7.42 |
| Canon EOS 40D (Camera JPEG) |
10.6 | 9.52 | 8.78 | 7.42 |
| Nikon D3X (Camera JPEG) |
-- | -- | -- | 7.37 |
| Nikon D50 (Camera JPEG) |
10.7 | 9.93 | 8.70 | 7.36 |
| Panasonic DMC-G2 (Adobe Camera Raw 5.7) |
10.3 | 9.87 | 8.77 | 7.35 |
| Sony A380 (Camera JPEG) (DRO Standard by default) |
-- | 9.54 | 8.84 | 7.32 |
| Panasonic DMC-G1 (Adobe Camera Raw 5.2) |
10.7 | 9.78 | 8.70 | 7.32 |
| Nikon D3000 (Camera JPEG) |
10.2 | 9.64 | 8.69 | 7.31 |
| Sony A900 (Camera JPEG) (DRO off by default ) |
10.2 | 9.75 | 8.49 | 7.31 |
| Sony A330 (Camera JPEG) (DRO Standard by default) |
10.1 | 9.37 | 8.59 | 7.30 |
| Sony A200 (Camera JPEG) (DRO on by default) |
10.4 | 9.43 | 8.91 | 7.29 |
| Canon EOS 20D (Camera JPEG) |
10.3 | 9.66 | 8.85 | 7.29 |
| Canon EOS 30D (Camera JPEG) |
10.3 | 9.50 | 8.57 | 7.29 |
| Nikon D40 (Camera JPEG) |
10.4 | 9.80 | 8.89 | 7.28 |
| Sony A230 (Camera JPEG) (DRO Standard by default) |
10.1 | 9.51 | 8.51 | 7.26 |
| Sony A900 (Camera JPEG) (DRO on) |
10.1 | 9.76 | 8.47 | 7.26 |
| Canon Rebel XS (Camera JPEG) |
10.3 | 9.4 | 8.61 | 7.22 |
| Olympus E-520 (Adobe Camera Raw 4.5) |
11.0 | 9.46 | 8.70 | 7.20 |
| Sony A350 (Camera JPEG) (DRO on by default) |
10.3 | 9.55 | 8.85 | 7.19 |
| Pentax K-x Camera JPEG |
9.99 | 8.94 | 8.31 | 7.18 |
| Panasonic DMC-GF1 (Adobe Camera Raw 5.5) |
10.2 | 9.62 | 8.62 | 7.16 |
| Nikon D80 (Camera JPEG) |
10.1 | 9.43 | 8.48 | 7.12 |
| Canon Digital Rebel XT (Camera JPEG) |
10.3 | 9.51 | 8.61 | 7.11 |
| Nikon D200 (Camera JPEG) |
-- | 9.07 | 8.36 | 7.11 |
| Olympus E-300 (Camera JPEG) |
10.8 | 9.26 | 8.48 | 7.07 |
| Olympus E-410 (Adobe Camera Raw 4.1) |
10.2 | 9.40 | 8.24 | 7.05 |
| Olympus E-500 (Camera JPEG) |
10.0 | 9.14 | 8.16 | 7.05 |
| Canon Digital Rebel XTi (Camera JPEG) |
9.83 | 9.10 | 8.27 | 7.04 |
| Canon EOS-1Ds Mark II (Camera JPEG) |
10.3 | 9.38 | 8.60 | 7.04 |
| Panasonic DMC-G1 (Camera JPEG) |
-- | 9.33 | 8.52 | 7.03 |
| Pentax K200D (Camera JPEG) |
-- | 9.50 | 8.30 | 7.01 |
| 7.0 Stops | ||||
| Panasonic DMC-GF1 (Camera JPEG) |
-- | 9.33 | 8.44 | 6.99 |
| Canon Digital Rebel (Camera JPEG) |
10.1 | 9.11 | 8.47 | 6.97 |
| Nikon D2Xs (Camera JPEG) |
9.82 | 8.98 | 8.23 | 6.97 |
| Panasonic DMC-L10 (Adobe Camera Raw 4.2) |
10.4 | 9.34 | 8.48 | 6.91 |
| Sigma DP1 (Camera JPEG) |
-- | 8.95 | 8.13 | 6.91 |
| Pentax *istDs (Camera JPEG) |
10.2 | 10.0 | 8.87 | 6.90 |
| Sony A100 (Camera JPEG) |
10.2 | 9.24 | 8.39 | 6.89 |
| Samsung NX10 (Camera JPEG, Smart Range, ISO 200) |
10.1 | 8.99 | 8.22 | 6.78 |
| Pentax K100D (Camera JPEG) |
10.3 | 9.30 | 8.39 | 6.73 |
| Panasonic DMC-G2 (Camera JPEG) |
9.72 | 9.18 | 8.15 | 6.68 |
| Pentax K20D (Camera JPEG) |
10.2 | 9.21 | 8.09 | 6.66 |
| Pentax K-7 (Camera JPEG) |
9.59 | 8.87 | 8.03 | 6.54 |
| 6.5 Stops | ||||
| Nikon D2x (Camera JPEG) |
-- | 8.93 | 7.75 | 6.43 |
| Olympus E-3 (Camera JPEG) |
9.32 | 9.06 | 8.50 | 6.42 |
| Panasonic DMC-L10 (Camera JPEG) |
-- | 8.94 | 8.00 | 6.38 |
| Olympus E-420 (Camera JPEG) |
9.18 | 8.82 | 7.93 | 6.37 |
| 6.0 Stops | ||||
| Olympus E-410 (Camera JPEG) |
-- | -- | 7.60 | 5.99 |
| Samsung NX10 (Camera JPEG) |
9.32 | 8.48 | 7.46 | 5.88 |
| Nikon D70s (Camera JPEG) |
9.84 | 8.69 | 7.46 | 5.85 |
| Nikon D70 (Camera JPEG) |
9.81 | 8.76 | 7.58 | 5.84 |
| Olympus E-520 (Camera JPEG) |
9.32 | 8.68 | 7.74 | 5.74 |
| Olympus E-P2 (Camera JPEG, Gradation = Normal) |
10.1 | 8.83 | 7.78 | 5.58 |
| Olympus E-P1 (Camera JPEG, Gradation = Normal) |
-- | 8.85 | 7.74 | 5.47 |
Note that this test is repeatable to within 1/3 EV according to the Imatest website, so differences of less than 0.33 can be ignored.
As noted above, the Panasonic G2's dynamic range at the highest quality level was better than its current SLD competition, but fell slightly short of Panasonic's own GH1 and GF1 models, and quite a bit short of current SLRs with APS-C size sensors. This may be the result of Panasonic's favoring of subtle image detail over noise reduction. If you're willing to accept a bit more noise in calculating usable dynamic range (the Medium, and Medium-Low thresholds, for instance), the camera holds up pretty well against many models with APS-C sensors.
Panasonic G2 Resolution Chart Test Results
The chart above shows consolidated results from spatial frequency response measurements in both the horizontal and vertical axes. The "MTF 50" numbers tend to correlate best with visual perceptions of sharpness, so those are what we focus on here. The uncorrected resolution figures are 2,333 line widths per picture height in the horizontal direction (corresponding to the vertically-oriented edge), and 2,231 lines along the vertical axis (corresponding to the horizontally-oriented edge), for a combined average of 2,282 LW/PH. Correcting to a "standardized" sharpening with a one-pixel radius decreased both horizontal and vertical numbers a fair bit, resulting in an average of 1,730 LW/PH. (This reflects the fact that the G2's images are technically a bit oversharpened at the default sharpness setting.)
The Panasonic G2 delivers good resolution, competitive with 12-megapixel DSLRs currently on the market, although slightly less than we saw from the Olympus E-P2. Images straight from the camera show good detail, and even more can be extracted with careful RAW processing.
To see what's going on, refer to the plots below, which show the actual edge profiles for both horizontal and vertical edges, in both their original and corrected forms. Here, you can see that a moderate amount of in-camera sharpening is applied in both the horizontal and vertical directions (oversharpened according to Imatest's calculations by 17.8% and 12.5%, respectively, explaining why the sharpness dropped so much when the standardized sharpening was applied). You should thus turn the camera's sharpening down a little for optimal results when sharpening in-camera JPEGs post-exposure in Adobe Photoshop or other image editing software.
Note: We don't feature SFR-based LW/PH resolution numbers more prominently in our reviews (eg, outside the Imatest pages) because we've found that they're *very* sensitive to minor differences in in-camera image processing. Relatively small changes in the amount of in-camera sharpening can have a large effect on the resulting resolution numbers. Imatest attempts to compensate for this by adjusting to a "standard" sharpening, but this approach can't completely undo what happens inside the cameras, and so often gives inconsistent results. Sometimes the "standardized" sharpening happens to just match the shape of the edge profile with the in-camera sharpening applied, and you'll get wildly high results. At other times, it will tend to correct in the opposite direction. Unfortunately, ignoring the in-camera sharpening entirely can result in even greater discrepancies, particularly between models from different manufacturers. Turning off sharpening in the camera may or may not fully eliminate the sharpening, so simply turning off sharpening in the camera JPEGs isn't a reliable solution. It also wouldn't be the way most people shoot the cameras. We could process RAW files with no sharpening (as shown below), but then that'd only suit the people working primarily or exclusively from RAW, and would open another can of worms as to what RAW converter was used, etc, etc.
The bottom line is that numbers for resolution only take you so far. Detail handling and edge acuity are very complex issues; ones that don't easily boil down to a single number. The best approach is to simply look look at the broad array of standardized test shots we take with each camera, to the point of downloading and printing them with whatever processing you'd use if you owned the camera and shot with it. See how the differences stack up for you visually, and make your decision on that, rather than on abstract resolution numbers.
 Fujifilm GFX 50S Review
 Fujifilm X-T3 Review
 Olympus E-M5 III Review
Follow Imaging Resource